
Application Dashboard
4 min
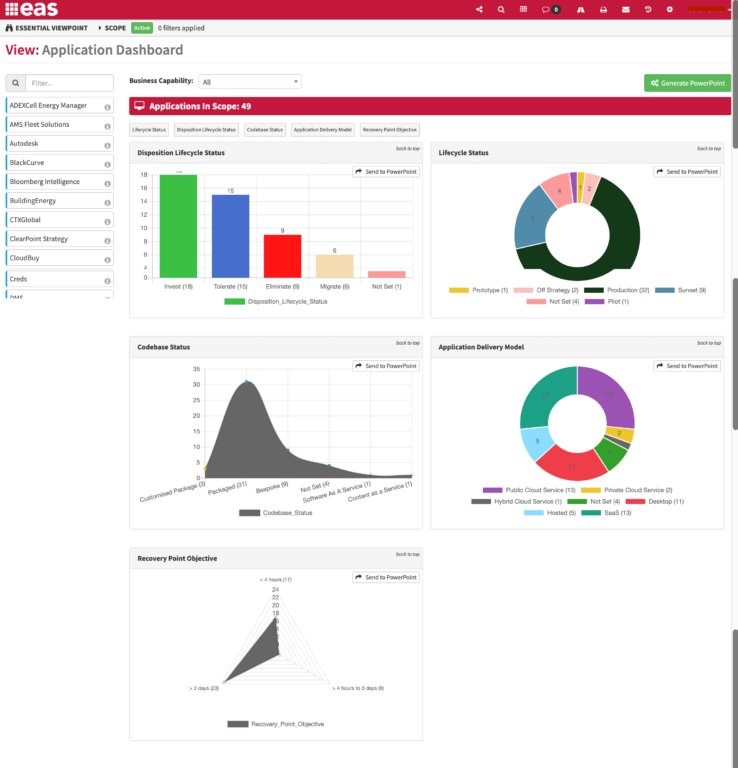
The Application Dashboard visualises different aspects of the application estate in different chart types. The charts can be exported to PowerPoint, so a presentation can be created and stored if required.
What
The Application Dashboard allows you to view different measurements against the application estate, for example, the split by Disposition Lifecycle Status, Codebase Status or Deployment Status. The user can pick the chart type and the “Send to PowerPoint” option allows you to pick charts to add to a PowerPoint presentation that can be exported if required.
Usage
Use the view to understand different aspects of your Application Portfolio, and to track change over time using the PowerPoint export.
Data Required
The Essential meta model has a number of Enumerations that can be used to capture characteristics of the application estate. Users can change the enumeration terms and add their own enumerations as required.
View Set-up
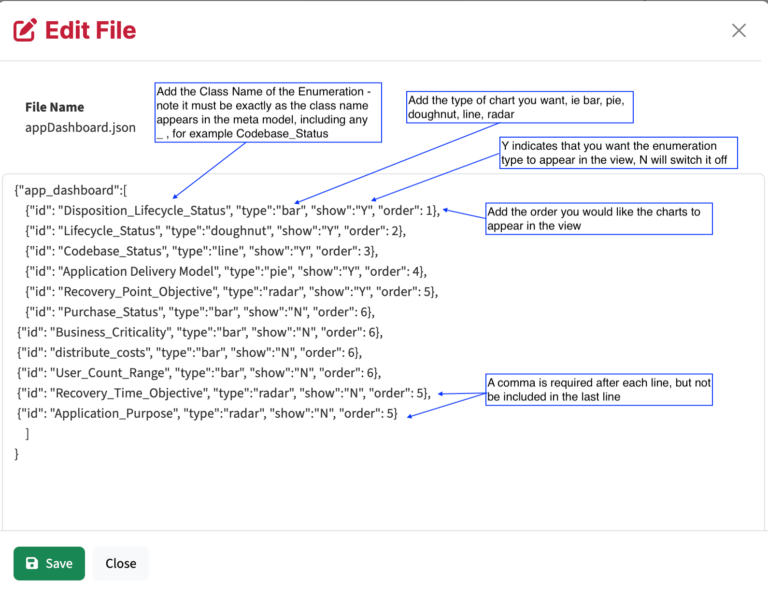
Out of the box the view shows all enumerations as pie charts by default. A JSON file can be added to the user folder of viewer and edited to change chart type to, for example, radar, bar, line or doughnut, or switch the chart off if you are not capturing data for it.
Access the json file ‘appDashboard.json here – appDashboard.json
Cloud: Upload to the viewer user folder in Configure/System Administration/View Management – select the required viewer and use the Upload button to upload file. Click on the file and use the Edit button to make and save any changes.
OS: drop the file in the user folder. Edit the file for you enumerations
Once loaded, the view will reflect the JSON file.
Note: do not change the name of the file
If an enumeration is not included in the JSON file then it will appear as a pie chart
To set colours to the chart View Styling should be set in the Element Styling Class slot on the Enumeration.
Updated 28 February 2024