

Essential’s Enterprise Architecture views turn architecture data into visual information that supports specific decisions. Rather than maintaining disconnected diagrams, Essential views are generated from a shared semantic model, allowing information about capabilities, processes, applications, technologies, organisations, suppliers and strategic change to be viewed from different perspectives.
All of these views work in both the free, Open Source version and the commercial versions of our EA tool
Supplier Sovereignty Dashboard
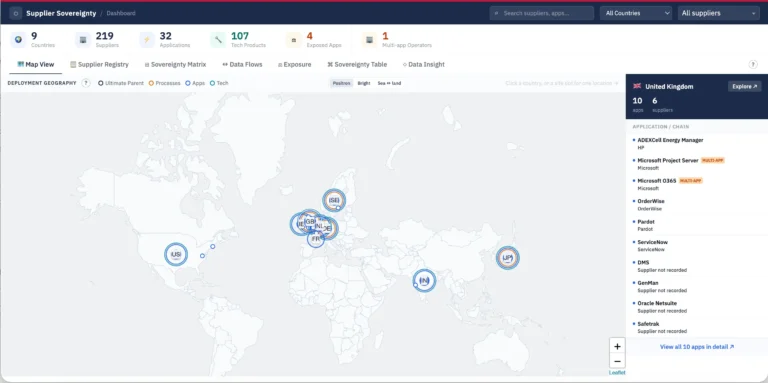
Shows the supplier, application, technology, process, ownership and regulatory relationships that determine where services operate and where sovereignty exposure may exist.
What questions does this answer?
Which suppliers, applications, technology products and processes are present in each country or site?
Who operates a supplier, who is its ultimate parent, and which child organisations contribute to the impact?
Where is application data stored, where is it used, and which processes create that usage footprint?
Which applications handle Data Objects explicitly in scope of a Regulation?
Which relationships and locations are recorded, and where are the gaps?
How to install
Download the supplier-sovereignty-view and extract it into your Essential viewer’s
user folder.
Apply the DUP included in the package to create the report. The report will then appear in the Enterprise section of the View Library.
What architecture information is used?
| Dashboard result | Required relationship or value |
|---|---|
| Supplier location and ultimate parent |
Supplier-to-actor ownership, theis_member_of_actorhierarchy, and Legal Entity domicile through legal_entity_domiciled_in_geos. The hierarchy is followed for up to five steps. |
| Fallback supplier location | If Legal Entity domicile is not recorded, Group Actor sites are used and the result is flagged for confirmation. |
| Application deployment geography | Application deployment → Technology Instance → Technology Node → Site → geographic location → Geographic Region. |
| Technology product geography | Associated application deployments → Technology Instance → Technology Node → Site → location → region. |
| Process geography | Application-to-process mapping plus the process performing site → site geographic location → Geographic Region. |
| Regulated data |
Regulation →REGULATED_COMPONENT_RELATION→ Data Object, then Data Objects mapped to applications and processes through the supported data routes. |
| Contract and control position | Supplier/operator and parent relationships, relevant contracts, and contract coverage or lifecycle values. |
Legal domicile and ultimate parent
Application, technology and process locations
Regulation and exposure
What each page shows
Country and site footprint for ultimate parents, processes, applications and technology. Select a country or site dot to see the records at that location.
Supplier base location, application and technology counts, deployment countries, operator and ultimate-parent chain. “Multiple processes” and “Multiple sites” open detail panels.
Supplier-by-country presence, including ultimate-parent, application, technology and process impacts. Select a cell to inspect its data and child-supplier impacts.
Data categories, storage locations, process “Used from” locations, supplier control and contract position. Select a Used from location to see the processes causing it.
Applications meeting the confirmed exposure criteria, with assessment, storage, usage, findings and explicit regulation badges.
Relationship table for a selected application, technology product or process, showing the repository paths behind the result.
Data Model and Data Gaps. The model shows required classes and relationship paths; gaps show recorded and missing coverage.
How to use the view
- Use the global search to filter suppliers, applications, technology products, processes and locations.
-
Use
All Countries
to restrict results to one country, and
All suppliers
to focus on one supplier and its network. - On the map, select a country or site dot. Selecting a site keeps the current zoom and opens site details.
- Use the clickable counts and indicators in the registry to open applications, technology, sites or processes.
- In the matrix, select a cell to inspect applications, technology, processes, mapped sites and impacts inherited from child suppliers.
- Use Data Insight → Data Model to understand required paths and Data Insight → Data Gaps to see missing links.
means the required repository value or relationship is absent from the data available to the view. It does not prove that the value does not exist in the organisation.
Technology Radar
Shows you your technology disposition by Technology Capability

This view uses disposition on technology product roles, e.g. Tomcat as a Web Server. to show the disposition and impacts on applications and processes
Each product is shown as a circle in the flat radar view. When 3D mode is enabled, the circles become towers. The tower height and circle size represent the selected usage measure
What questions does this answer?
| Data | Required relationship or value |
|---|---|
| Technology capabilities | Capabilities linked to technology components |
| Technology components | realisation_of_technology_capability points to one or more capabilities |
| Technology products | Products linked to technology product roles |
| Technology product roles | role_for_technology_provider points to a product; implementing_technology_component points to a component |
| Dispositions | Product roles link through tl_disposition_lifecycle_status |
| Disposition order | Each disposition should have a usable sequence/order value |
| Lifecycle colours | An Element_Style points to each disposition and supplies element_style_colour |
| Supplier and vendor lifecycle | Products link through supplier_technology_product and vendor_product_lifecycle_status |
Note this requires the technology disposition slot on the Technology Product Roles so you will need to have applied the 6.21 meta model release for that.
Application usage
To show application usage and application names, the model needs this dependency path:
In Cloud/Docker, this is straightforward to set up using the Technology dependency editor tab on the application editor.
The application instances must have a populated name slot. The radar uses application identifiers for counting, then resolves the visible names through the dependency traversal API.
Business process usage
To show the processes supported by applications, each application must be mapped to its physical processes. The dependency traversal follows:
In Cloud/Docker, use the Business Capability to Application drag-and-drop editor to create these relationships if they do not already exist.
Business process names come from Business_Process.name. Processes with a criticality ending in High or Critical are marked as Critical in the process drawer.
How to install
technology_radar
How to use the view
1. Select capabilities
Use the capability chips in the Segments bar to see the capabilities currently selected. Select Add capability to open the capability selector.
- Select a capability to add it to the radar.
- Use the
×on a chip to remove it. - Only capabilities with linked technology products appear.
2. Read the radar
- Concentric rings represent disposition lifecycle stages.
- The legend maps each ring to its lifecycle colour.
- Product circles use the matching disposition colour.
- Larger circles indicate more of the selected usage measure.
- In 3D mode, the same measure controls tower height.
Products are laid out by capability, disposition, and product name to reduce visual overlap.
3. Change the sizing measure
Use Size by to choose how product circles and towers are scaled:
- Applications — size by application usage.
- Business capabilities — size by business capability usage.
- Equal — give each product an equal baseline size.
Size changes animate smoothly.
4. Focus on one capability
Each capability label has a circular control at its outer edge:
Focus capability
Restore radar
Selecting the magnifying-glass control focuses the radar on that capability. A radar sweep then reveals the products and names as it passes over them. Select the upward-arrow control to restore the previous capability selection.
5. Use 3D mode
Select 3D to animate the radar into a tilted view. Product circles rise into towers, with taller towers representing greater usage.
Product and capability names remain readable and flat while disposition labels follow the tilted radar. Select Flat to animate back.
6. Inspect a product
Click a product circle or tower to open its technology product panel. The panel shows product context, lifecycle information, usage totals, and related data links.
Application and business-capability usage values are interactive. Deployments are not shown in this view.
7. View applications and processes
- Click the application usage value in the product panel.
- An Applications drawer opens with resolved application names in alphabetical order.
- The Processes drawer opens alongside it with the processes supported by those applications.
- Critical processes are highlighted with a Critical label.
- Click an application name to filter the process drawer to processes supported by that application.
- Close either drawer using its
×control.
While names are being resolved, the Applications drawer shows pulsing loading placeholders instead of raw identifiers.
Data Centre map
Shows you the sites of your servers and the applications and technologies mapped to those
 |
 |
What questions does this answer?
Which applications and APIs are hosted at each data centre?
Which technology nodes support those applications?
Which applications communicate with each other, and where are they hosted?
Which sites host critical business processes?
What architecture information is used?
Business processes are identified through the relationship:
Sites and map positions
Each Site is located through the following relationship:
The map reads the location from:
geocode_latitudegeocode_longitude
If coordinates are missing, the site cannot be positioned reliably on the map.
Technology node counts
Technology nodes are linked to sites through:
The technology node count controls:
- The tower height in 3D mode
- The site summary metrics
- The Technology Nodes tab
- The
Countselector
Application counts
Applications are identified through their deployment chain:
Integration flows
Integration relationships can be captured through the deployment tab in the Application Editor, using drag and drop or the Launchpad Plus integrations sheet.
The Launchpad Plus integrations sheet can be used to speed up integration capture.
Integration data is based on:
Each integration relation contains:
- A
:FROMendpoint - A
:TOendpoint - A relation name
- A
Static_Application_Provider_Usagerecord at each endpoint
Integration flows are shown only when:
- Integration flows are enabled.
- A site has been selected.
- The source or target application is hosted at that site.
- The other endpoint can be mapped to a known site.
How to install
Cloud
Extract the files below and upload its contents to the viewer’s user folder (select the zip file in the extracted file and upload that). Apply the DUP to create the report. The view will appear in the Technology section of the View Library.
data_centre_cloud_files
OS
Extract the file below into the relevant viewer folders. Apply the DUP to create the report. The view will appear in the Technology section of the View Library.
data_centre_map_os
How to use the view
- Ensure that sites have valid latitude and longitude values.
- Open the Data Centre Map from the Technology section.
- Select a site on the map.
- Use the tabs to inspect technology nodes, applications and business processes.
- Click an application or API to view its integrations and hosting sites.
- Enable Integration Flows to display animated relationships involving the selected site.
- Select a class and instance where available to open the related network diagram.
- Use View Layers to switch to the column-based view.
- Hover over paths to inspect them, or click a path to keep it highlighted.
Node Tubemap
Allows you to select an instance in Essential and see its core connections, from Business Capability down to Servers (Technology Nodes). Allows you to see key connections and dependencies in the enterprise architecture

What questions does this answer?
Which applications support a business capability?
What happens if this server goes down, and which business processes are impacted?
Which business processes does this application support?
Which processes are performed at this site?
What architecture information is used?
The view uses information captured in the Essential repository and navigates through the following relationship chain:
→ Application Service → Application
→ Deployments → Technology → Sites
How to install
Download the Node Tube Map package and extract it into your Essential viewer’s
user folder.node_tubemap file
Apply the DUP included in the package to create the report. The report will then appear in the Support section of the View Library.
How to use the view
- Select a class.
- Select an instance.
- Review the resulting network diagram.
- Use View Layers to switch to the column-based view.
- Hover over paths to inspect relationships.
- Click a path to keep it highlighted.
Please note: These views are provided ‘as is’ and may subsequently be incorporated into a production release of Essential. Where this happens, the production version may differ in appearance, functionality or implementation from the version provided here.